Changes in oscillatory neural dynamics reflect—but may not necessarily determine—transitions between sleep stages and variations in sleep pressure. Here we show that sleep-control neurons innervating the dorsal fan-shaped body of Drosophila (dFBNs) produce slow-wave activity (SWA) that is causally linked to sleep. The dFBN ensemble contains bistable cells whose membrane voltages oscillate between hyperpolarized DOWN and depolarized UP states.
The oscillations rely on interhemispheric competition of two half-centers connected by inhibitory glutamatergic synapses. dFBN-restricted interference with glutamate release disrupts SWA and baseline as well as rebound sleep, whereas the optogenetic replay of SWA induces sleep. dFBNs generate SWA throughout the sleep–wake cycle (despite mutual antagonism with arousing dopaminergic neurons) and adjust its power to sleep need via sleep history-dependent increases in excitability and homeostatic synaptic depression. The oscillatory format permits a continuous encoding of sleep pressure but requires mechanisms that convert the amplitude-modulated signal into binary sleep–wake states. The dynamics of neurons responsible for the homeostatic regulation of sleep, like those of all feedback controllers, are coupled to the dynamics of the controlled object: the outputs of one system serve as inputs to the other.
Studies in Drosophila have begun to paint a detailed picture of how sleep-inducing neurons sense changes in the physiology of the sleeping and waking organism. Sleep-control neurons1,2 with projections to the dorsal layers of the fan-shaped body (dFBNs) estimate sleep pressure by monitoring the flow of electrons through their own mitochondria3,4. Sleep loss creates an imbalance between electron supply and ATP demand4 that diverts electrons from the respiratory chain into uncontrolled side reactions with molecular O2, producing reactive oxygen species3, which fragment the polyunsaturated fatty acyl (PUFA) chains of membrane lipids into short- or medium-chain carbonyls5. dFBNs count the release of PUFA-derived carbonyls (and transduce this signal into sleep) in a process that involves an allosteric dialog between the voltage-gated potassium channel Shaker—a critical determinant of dFBN activity6—and its carbonyl-reactive β-subunit Hyperkinetic3,5,7.
These insights were gained in experiments that clamped certain variables in order to isolate others. For example, to determine how sleep history2 or mitochondrial dynamics4 alter the current–spike frequency function of dFBNs, the neurons were driven with fixed current patterns; to resolve how cellular redox chemistry3, lipid peroxidation products5 or arousing dopamine6 modulate particular ion channels, the membrane potential of dFBNs was stepped between fixed voltages. How the unclamped dFBN population responds to changes in sleep pressure, and how these responses alter the sleep–wake state of the organism, therefore remains unknown.
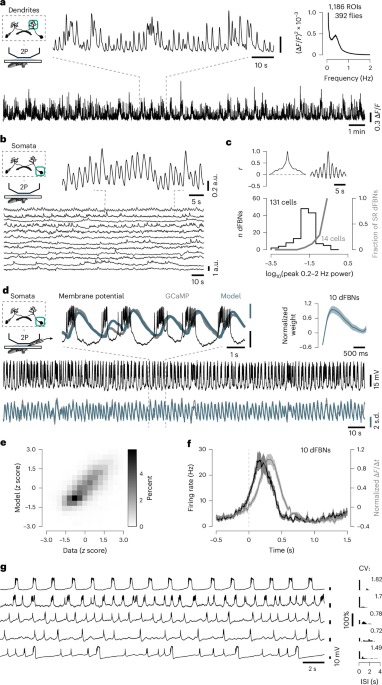
To visualize unperturbed dFBN ensemble activity in vivo, we implanted flies expressing the genetically encoded Ca2+-sensor GCaMP6f (GCaMP in brief) under the control of R23E10-GAL4 with translucent windows (Methods; Extended Data Fig. 1a,b) and imaged the dendritic tufts of dFBNs by two-photon microscopy. Dendritic fluorescence displayed prominent Ca2+ transients, which repeated rhythmically at 0.2–1 Hz (Fig. 1a and Supplementary Video 1). In analogy to the nomenclature in mammals8, we refer to activity in the frequency band of 0.2–2 Hz as slow-wave activity (SWA).
The regularity of GCaMP transients across the dataset in Fig. 1a raises the question of whether the entire dFBN population is engaged in synchronous oscillations or whether a subset of rhythmic cells dominates dendritic fluorescence, which represents a weighted sum of contributions from all dFBN processes in the imaged region. To distinguish these possibilities, we recorded simultaneous GCaMP signals from a median of 8 cell bodies (range: 3–12) in the same hemisphere (Fig. 1b and Supplementary Video 2) and found that time series of somatic fluorescence were, on average, uncorrelated (Pearson r = 0.05 ± 0.15, mean ± s.d). Different dFBNs concentrated variable amounts of power in the 0.2–2 Hz band, giving rise to a heavily skewed distribution (Fig. 1c, note the logarithmic scale).
Extract — continue reading at the source.