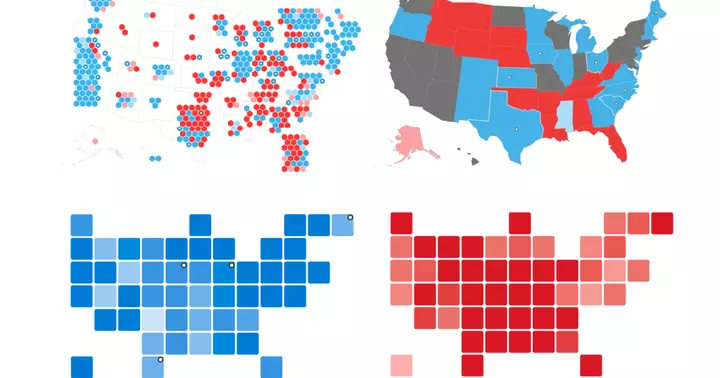
A Democratic wave swept the United States Congress as Americans turned out in near-record numbers to strip President Donald Trump’s Republicans of their majorities in both the House of Representatives and the Senate. About 122.7 million ballots have already been counted in the November 3 midterm elections, according to preliminary estimates from the University of Florida’s Election Lab. About 48.8 percent of the eligible population voted, the second-highest midterm turnout in more than a century, just below 2018.
In this visual explainer, Al Jazeera maps the seats Democrats flipped, charts turnout across the country, and looks at the history made on election night. Votes are still being counted, but as of on Thursday, November 5, Democrats have won at least 240 seats in the House and 54 in the Senate, enough to control both chambers. Republicans have won 147 House seats and 44 in the Senate.
Forty-eight House races and two Senate races, in Alaska and Mississippi, have yet to be called. Democrats could end up with more than 260 seats in the House and 56 in the Senate. The widget below shows the latest results as they come in.
Visit this page for full live results. Of about 210 million registered voters, 54.5 million had already cast their ballots early by 10am US East Coast time ( ) on Sunday, November 1, according to the University of Florida’s Election Lab. About 30 million voted in person and 24 million by mail.
By the time polls closed on Tuesday, the total had more than doubled. The Election Lab estimates that 122.7 million ballots have been tallied, with 48.76 percent of eligible voters casting a ballot. Turnout varied widely by state.
Maine recorded the highest, with 65.78 percent of eligible voters casting a ballot, followed by Minnesota (65.16 percent) and Michigan (63.65 percent). West Virginia had the lowest, at 33.33 percent, followed by Oklahoma (37.08 percent) and Hawaii (37.68 percent). The map below shows voter turnout by state.
Extract — continue reading at the source.