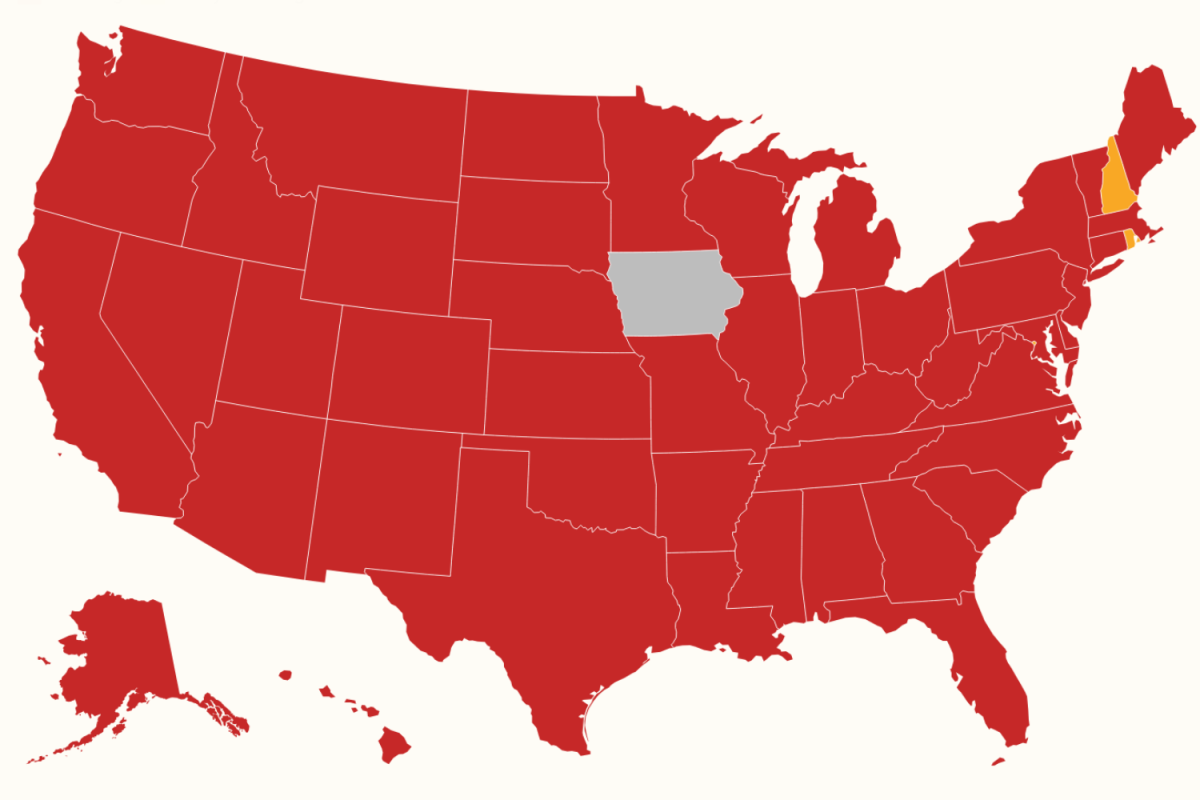
COVID-19 infections are estimated to be growing in virtually every corner of the United States, according to the Centers for Disease Control and Prevention's latest epidemic modeling. As of August 12, the CDC estimates COVID-19 infections are growing or likely growing in 50 states and the District of Columbia. Iowa is the lone exception, with insufficient data available for the agency to generate a trend estimate.
The update marks a significant shift from just three weeks ago. On July 22, the CDC estimated infections were growing or likely growing in 37 states, while 11 states were seeing little change in transmission. Those stable pockets have now disappeared from the map.
The CDC's Current Epidemic Trends model estimates whether infections are increasing, decreasing or remaining stable. The latest figures suggest the summer COVID wave that emerged in parts of the South and West in July has expanded into a nationwide trend. Forty-seven states are now classified as "Growing," while New Hampshire, Rhode Island and the District of Columbia are categorized as "Likely Growing." No state is currently listed as "Not Changing," "Declining" or "Likely Declining." The national estimate also remains above the threshold that indicates transmission growth.
Large states including California, Texas, Florida, New York, Pennsylvania, Illinois and Georgia are all showing growth, while much of the Midwest, Northeast, South and Mountain West are reporting the same trend. In many states, the CDC estimates there is greater than a 99 percent probability that infections are increasing. The model does not estimate how many Americans currently have COVID-19.
Instead, it assesses whether transmission is moving up or down. That makes it one of the CDC's earliest indicators of changing disease activity, often highlighting trends before they become apparent in other surveillance data. The August map is notable because it is almost entirely red, indicating growth in disease potential across the country.
Andrew Pekosz, Professor of Molecular Microbiology and Immunology at Johns Hopkins Bloomberg School of Public Health told Newsweek: “This looks like a pattern that has been documented in the past few years. Late summer/early fall surge of COVID cases seems to be part of the expected pattern of COVID-19 cases that we see. This is what we have come to expect from COVID-19 now that we are in the “seasonal” phase and out of the “pandemic” phase of the disease.
Extract — continue reading at the source.